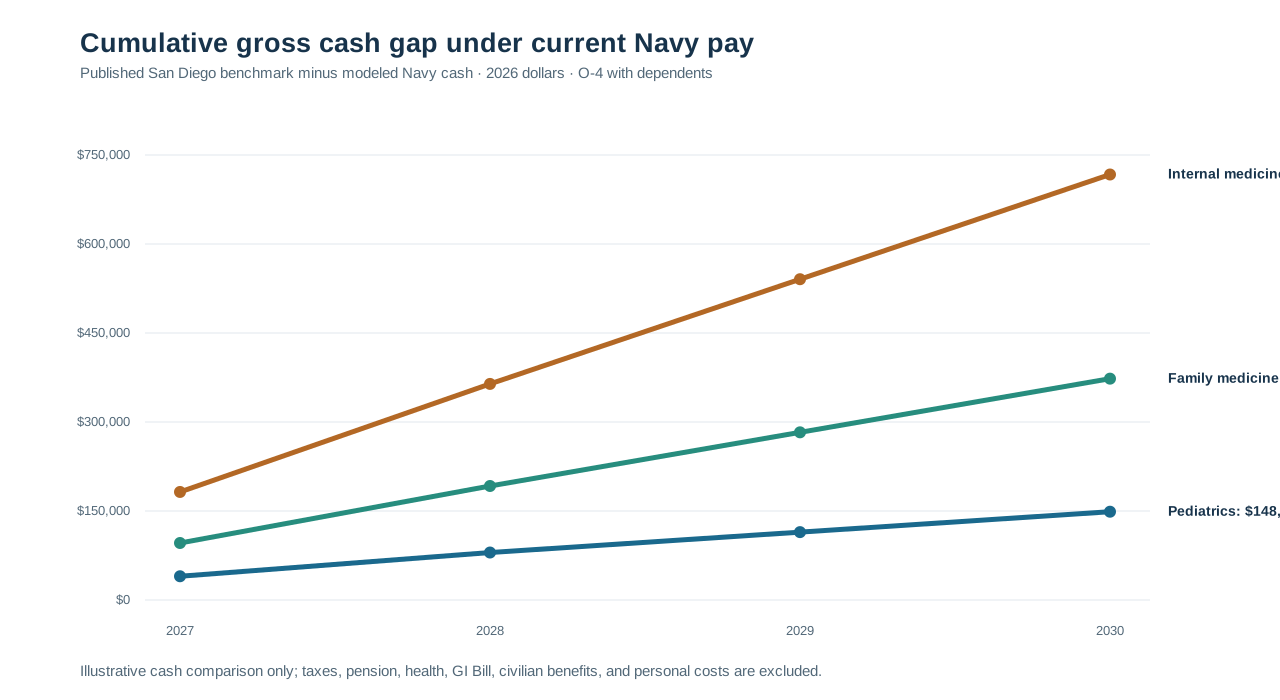
Current timing update (September 19, 2026): base-case cash flows now use 5% real discounting at year-end. The historical analysis below retains its earlier beginning-of-year values. Use the current internal-medicine audit for the paper and current lab comparison; do not mix the timing conventions.
Course interpretation. This table shows a gross cash difference, not a measured retention effect. Principles of Economics distinguishes the best forgone alternative and marginal future consequences (Frank et al., 2019, pp. 5–8), real from nominal amounts (p. 324), and a wage incentive from an observed labor-supply response (pp. 73–80, 376–385). Pension and TSP are financial compensation that must be compared over time; mission and clinical opportunities are job attributes whose personal values are not in this table. The course crosswalk maps the relevant chapters to the project.
Four-year illustrative agreement, 2027–2030, in constant 2026 dollars. The profile is a board-certified O-4 just past 10 years of service, with dependents, assigned to ZIP 92134 and eligible for the listed FY26 special pays. Only the current FY26 retention bonus is included.
San Diego is a local case in a wider Pacific medical-workforce problem. Naval Medical Forces Pacific is headquartered in San Diego and includes commands in Hawaii, Japan, and Guam; its mission is to keep assigned forces ready to deploy. This table measures compensation differences, not physician departures, vacancies, deployability, or a readiness effect. Linking retention to Pacific operations requires those outcome data by specialty and billet.
| Specialty | Year | Marit San Diego benchmark | Current Navy cash | Current cash gap |
|---|---|---|---|---|
| Pediatrics | 2027 | $303,974.00 | $263,965.76 | $40,008.24 |
| Pediatrics | 2028 | $303,974.00 | $263,965.76 | $40,008.24 |
| Pediatrics | 2029 | $303,974.00 | $269,585.36 | $34,388.64 |
| Pediatrics | 2030 | $303,974.00 | $269,585.36 | $34,388.64 |
| Internal medicine | 2027 | $459,057.00 | $276,965.76 | $182,091.24 |
| Internal medicine | 2028 | $459,057.00 | $276,965.76 | $182,091.24 |
| Internal medicine | 2029 | $459,057.00 | $282,585.36 | $176,471.64 |
| Internal medicine | 2030 | $459,057.00 | $282,585.36 | $176,471.64 |
| Family medicine | 2027 | $373,038.00 | $276,965.76 | $96,072.24 |
| Family medicine | 2028 | $373,038.00 | $276,965.76 | $96,072.24 |
| Family medicine | 2029 | $373,038.00 | $282,585.36 | $90,452.64 |
| Family medicine | 2030 | $373,038.00 | $282,585.36 | $90,452.64 |
| Specialty | Current annual RB | Four-year gross cash gap | PV at 5% | Annual equivalent |
|---|---|---|---|---|
| Pediatrics | $35,000.00 | $148,793.76 | $139,009.04 | $37,335.42 |
| Internal medicine | $48,000.00 | $717,125.76 | $668,019.29 | $179,418.42 |
| Family medicine | $48,000.00 | $373,049.76 | $347,749.21 | $93,399.42 |
Doximity’s 2026 report gives national specialty averages based on 2025 compensation responses. These do not replace a San Diego civilian offer and are not blended with Marit’s city benchmarks.
| Specialty | Doximity national average | Year 1 current Navy cash | Year 1 current gap |
|---|---|---|---|
| Pediatrics | $273,665.00 | $263,965.76 | $9,699.24 |
| Internal medicine | $339,274.00 | $276,965.76 | $62,308.24 |
| Family medicine | $325,040.00 | $276,965.76 | $48,074.24 |
The SalaryDr 2026 report provides another publicly visible national sensitivity check. Its figures are medians, not the same statistic as the Doximity averages or a San Diego offer. They come from verified self-reports through July 17, 2026; specialty samples are modest, and the internal-medicine group includes hospital medicine.
| Specialty | SalaryDr national median | Specialty responses | Year 1 current gap |
|---|---|---|---|
| Pediatrics | $310,000.00 | 261 | $46,034.24 |
| Internal medicine | $345,000.00 | 157 | $68,034.24 |
| Family medicine | $310,000.00 | 143 | $33,034.24 |
MedMoneyGuide’s specialty ranges are attributed to Medscape or Doximity, so adding them as a separate toggle would double-count those underlying reports. The NEJM CareerCenter compensation article discusses MGMA/AMGA data and pay-plan design but does not publish a matched, three-specialty dataset for this calculator. The lab therefore removes empty MGMA/AMGA choices and offers SalaryDr instead. Keep all national comparisons separate from the Marit local baseline and verify a real offer before interpreting any benchmark as a personal opportunity cost.
At current pay rates, clearer, targeted communication about real Navy-specific nonfinancial opportunities may improve agreement acceptance and later retention for primary-care physicians who value those opportunities. The effect may be smaller when a physician faces a larger verified financial advantage from civilian practice. The table quantifies a gross-cash proxy for the financial opportunity cost; the person-specific lab can add taxes, pension continuation, health, GI Bill transfer, and physician-paid costs. Neither the table nor the lab measures the personal value of leadership, teaching, research, specialty practice, operational experience, mission, or assignment stability.
Advertising changes awareness, not the underlying job. The hypothesis requires documenting which opportunities are actually available, whether physicians knew about them, and whether the information changes behavior. Compare eligible physicians receiving targeted, accurate information with a comparable group receiving standard information. Measure awareness first, then acceptance at an unobligated choice and later retention. A larger awareness score alone is insufficient. Record each person’s estimated financial gap to test whether it moderates the response. The FY25–FY26 internal-medicine pay change and assignment changes are potential confounders.
If awareness improves but acceptance and later retention do not, or if the advertised opportunities prove inaccessible, the hypothesis is weakened. The especially large modeled internist cash gap illustrates why communication may be insufficient for some physicians; it does not prove how any individual values Navy service. The policy objection is that information cannot compensate for a pay gap. The defensible response is conditional: it may reveal an existing opportunity the physician values, but the outcome data must show whether that affects retention.
The 12-row table measures gross cash gaps. It does not measure the full opportunity cost of remaining in the Navy. For an eligible physician at an unobligated decision, define two feasible paths over the same chosen horizon: stay for another agreement or accept a comparable civilian job. For each year, estimate after-tax Navy cash and civilian cash, add employer or service benefits that differ between the paths, and subtract expenses the physician actually bears. Discount each year’s difference and any later pension or education value to the decision date. The financial opportunity cost of staying is:
PV(civilian after-tax cash + incremental civilian benefits − physician-paid civilian costs)
− PV(Navy after-tax cash + incremental Navy benefits)
A positive result favors the civilian path financially; a negative result favors continued Navy service financially. Dividing the present-value difference by the present value of one dollar paid in each service year gives an annual equivalent. This is a model estimate conditional on the inputs, not an exact reservation wage or a prediction of behavior.
The existing cash table can supply a lower-information starting calculation. Discount its four annual gross-cash gaps at an illustrative 5% real rate, with 2027 as year 0 and no taxes or additional benefits priced:
| Specialty | Present value of four-year gross cash gap | Annual equivalent |
|---|---|---|
| Pediatrics | $139,009 | $37,335 |
| Internal medicine | $668,019 | $179,418 |
| Family medicine | $347,749 | $93,399 |
These are present values of benchmark cash differences, not complete opportunity-cost estimates. They use the published Marit city figures, hold compensation in constant 2026 dollars, and assume the O-4 pay path in the audit table. After-tax cash, benefits, physician-paid expenses, and actual civilian offers could change the sign or size of the full financial estimate.
The lab now has a separate career-path sensitivity for the pension question. To compare a physician with 10 years of service who might stay until 20, set the additional-service horizon to 10 years, enter expected real civilian pay growth, and estimate the tax on later pay changes. Select the actual retirement formula, projected High-3, years of pension receipt, pension tax assumption, and real discount rate. An optional leave-active-duty path can include a Reserve pension using projected qualifying years, retirement points, and pay-start age. The lab discounts each modeled pension to today’s decision and includes only the active-minus-Reserve difference. It also accepts future Navy TSP government contributions and civilian employer benefits as separate inputs. Under DoD active and Reserve rules, the BRS and legacy High-36 multipliers are 2.0% and 2.5% per creditable year, respectively; Reserve points are divided by 360 for equivalent service. The four-year audit table above remains a gross-cash baseline and does not change when these personal assumptions change.
This is not yet a complete lifetime earnings model. It holds the selected Navy rank and many pay items fixed in real terms. The pension result is conditional on completion of the entered paths; the lab does not estimate the probability of either path. Its Reserve branch omits drill income, Reserve TSP, and gray-area health costs. Mortality, post-retirement earnings differences, and additional pension accrual for a member already eligible at 20 active years are also outside the calculation. A $0 active pension in a 10-to-14-year window means the selected horizon stops before eligibility, not that four more years of service have no future value. The year table shows gross cash; the separate present-value result includes the net conditional pension and other entered adjustments.
| Input needed beyond the cash table | How it enters | Status |
|---|---|---|
| Comparable civilian-only San Diego offer, including expected incentives, hours, call, and practice setting | Defines the feasible outside option | Marit is a citywide mixed-employer proxy; an individual offer is missing. |
| Federal and state tax treatment of each path | Converts gross cash to after-tax cash; BAH and BAS are already in Navy cash but generally tax-exempt | Person-specific assumptions are missing; do not assign a universal tax advantage. |
| Civilian retirement match, health and leave benefits, and Navy TRICARE/TSP differences | Add only value that changes with the stay-versus-leave choice | Specific civilian offer and household inputs are missing. |
| Pension system, service credit, promotion path, and probability of reaching retirement | Expected incremental pension present value | No generic pension dollar value applies to the O-4-over-10 profile. |
| GI Bill transfer status and dependent use | Value contingent on further service, if any | Already earned personal entitlement is not lost on separation. |
| Physician-paid malpractice premium and tail, if any | Deduct from the civilian path only when the physician bears the cost | Employer-paid coverage or costs already reflected in reported net compensation count as $0. |
| Discount rate, decision horizon, and subsequent career path | Converts future differences to present value | State and vary these assumptions. |
The nonfinancial threshold is the remaining positive financial opportunity cost under the current compensation package: the physician would have to value Navy-specific nonpay attributes at least that much over the horizon to prefer staying on this simplified model. The study does not observe that value. Assignment stability, clinical practice, mission, and family time should be reported as separate attributes or elicited in a survey, rather than automatically converted to dollars. Retention outcomes are needed to learn whether communication about available opportunities changes choices.
The civilian alternative is the opportunity cost of staying. The existing FY26 retention bonus raises the marginal financial return to another Navy agreement; assignment stability and protected clinical practice can also affect the nonpay value of staying. A compensating wage differential may be needed when Navy service entails less geographic or professional flexibility. These are mechanisms, not measured effect sizes.
The next empirical step is to observe whether eligible physicians accept current agreements and remain after their obligations, by specialty and career stage. The FY25–FY26 internal-medicine bonus change offers a possible natural comparison only if contract timing, concurrent changes, and actual outcomes can be observed. A four-year agreement mechanically commits an accepter for four years, so acceptance and post-obligation retention are distinct outcomes. GAO reports that DOD lacks consistent data on replacement costs, bonus acceptance, and private-sector wages; this model cannot estimate retention elasticity or cost effectiveness today.
GAO’s 2025 staffing review reports a roughly 16% decline in assigned military medical personnel across DOD from FY2015 to FY2023 and anticipated shortfalls through at least 2027. This is context, not a San Diego Navy primary-care attrition rate. GAO’s incentive review recommended collecting replacement cost, retention, and civilian-wage data.
Public Navy Medical Corps community values identify active specialty practice, skill maintenance, operational experience, and professional growth as priorities. GAO’s 2026 public review documents clinical-readiness opportunities from military-civilian partnerships and incomplete activity data for assessing them. These are reasons to track clinical practice as a possible nonpay retention factor, not evidence that it outweighs pay or changes retention by a known amount.
A physician-level evaluation should record assignment preferences and moves, clinical days in the primary specialty, partnership activity where applicable, training access, promotion timing, perceived mission connection and administrative burden, bonus eligibility and acceptance, and separation after the agreement. The fixed four-year table assumes O-4 throughout; it is not applicable unchanged to a physician promoted to O-5. Grade-dependent basic pay and BAH should be recalculated for that person’s promotion path.
Opportunity cost and choice. The relevant comparison is the expected value of staying for the next agreement versus the best feasible civilian offer over the same period, after taxes, incremental benefits, work hours, and any physician-valued nonpay differences. BUS 620 Session 3 (pp. 35–36) and Micro C5 (pp. 5–6) distinguish an accounting figure from an economic choice that includes the next-best alternative. Micro C6 consumer choice (pp. 5–14) and the indifference-curve reading (pp. 3–9) explain why the physician selects a bundle of pay, location, clinical autonomy, and family time. The Marit minus Navy cash gap is measurable here; a person’s utility-equivalent pay gap and marginal rate of substitution are not. The lab should identify the current cash gap as a benchmark comparison, not a retention threshold or an indifference point.
Marginal and sunk costs. Micro C4 (pp. 7–15) asks what changes with the next decision. For a future policy decision, compare any additional fiscal cost with the causal change in physicians retained and avoidable replacement or readiness costs. Past HPSP or training expenditures are sunk; outstanding obligations and future costs remain relevant.
Elasticity requires behavior. BUS 620 Session 1 (pp. 18, 24–30) defines elasticity as a percentage response to a percentage incentive change and shows why the time horizon matters. Here the response of interest is the percent change in acceptance or subsequent retention caused by a specified percent change in relevant Navy compensation. No such response can be calculated from the pay table. Short-run acceptance at the next unobligated decision and retention after the four-year agreement are different outcomes; the oil elasticities used in class are not physician labor-supply estimates. The FY25–FY26 internal-medicine RB change is a potential comparison only if individual eligibility, contract timing, concurrent changes, and outcomes can be observed.
Who pays and who benefits. BUS 620 Session 3’s “Who Paid?” framing (pp. 35–43) prompts a separate fiscal and welfare account. The Navy budget pays current compensation, and physicians receive it. A future change would require separate fiscal and retention accounting; the model does not price patient-access or readiness effects.
Limit of the analogy. BUS 620 Session 2 (pp. 13–16) derives a competitive seller’s supply rule from marginal cost. Navy Medicine is purchasing differentiated physician labor under statutory pay rules. That lecture’s price-equals-marginal-cost rule cannot be imported as a bonus formula. A later pay decision would require evidence that its marginal retention value justifies its cost.
| Benefit | Incremental question | Missing person-specific inputs |
|---|---|---|
| Pension | Does staying change the probability or amount of active-duty retirement benefits? | Retirement system, exact service years, projected High-3, continuation probability, taxes, discount rate, expected payment years. A four-year commitment from just over 10 years does not reach 20. |
| Healthcare | How much lower are expected household premiums and out-of-pocket costs under TRICARE? | Comparable civilian employer plan, dependent coverage, expected use, active-duty status. |
| GI Bill | Does staying create or preserve dependent-transfer value beyond rights already earned? | Remaining entitlement, approved transfer status, dependents, additional-service obligation, likely use. |
The companion figure is the cumulative-gap chart.
The attached NAVADMIN 229/25 is unclassified and confirms continuation of FY26 medical-department special-pay authority. It refers officers to corps-specific guidance. The supplied FY26 Medical Service Corps guidance concerns a different corps; Medical Corps guidance governs this physician scenario. The NAVADMIN and Medical Corps guidance establish the current rates used here. Any future rate change would require separate authority and approval.
A fuller benefits inventory is useful, but broad financial claims cannot be entered as fixed annual compensation. The current Navy cash line already contains BAH and BAS. DoD identifies both as generally tax-exempt allowances, so the gross Navy-versus-civilian comparison may understate Navy’s after-tax value. An after-tax sensitivity would apply individual federal and state tax assumptions to both paths and add only the resulting tax difference. It must not add BAH or BAS a second time. Conversely, the table omits possible civilian employer retirement contributions, health coverage, paid leave, and malpractice coverage. Actual offers are needed on both sides.
| Benefit or job attribute | Retention-relevant measure | Double-counting or comparability rule |
|---|---|---|
| Pension and BRS/TSP | Expected present value of additional retirement value caused by staying | Do not add a full lifetime pension to one year of cash or treat accrued/portable savings as lost on separation. |
| TRICARE and insurance | Household premium and expected out-of-pocket difference from a specific civilian plan; comparable life/disability protection | Compare like coverage and avoid counting the civilian employer contribution as both salary and benefit. |
| GI Bill transfer | Dependent-transfer value that depends on additional service | VA rules generally require six years served and four more agreed at transfer; already earned personal entitlement remains available after separation. |
| Leave, CME, clinical opportunity, assignments, mission | Hours, leave days, training funds/time, clinical days, location stability, stated preferences | Show separately unless a physician provides a defensible personal dollar value; these are possible compensating differentials, not measured retention effects. |
| Civilian overhead or malpractice | Physician-paid cost under the actual civilian job structure | Do not deduct practice-owner expenses from an employed physician salary without evidence the physician bears them. |
These additions do not change any row of the 12-row gross-cash table. They identify what would be needed to transform its arithmetic gap into an individual expected-value comparison. A frequently cited fixed pension value is inappropriate because retirement system, service years, High-3 pay, likelihood of reaching 20 years, taxes, and discounting vary. The policy outcome remains acceptance and subsequent retention, not modeled pay parity by itself.
10 U.S.C. § 1089 generally directs claims involving military medical personnel acting within the scope of duty to the federal remedy rather than an individual civil suit. That protection is not a universal shield for outside practice. In a civilian comparison, deduct only a premium the physician personally bears and any physician-paid tail cost under the actual contract, spread over the relevant horizon. AMA Insurance says employed physicians are typically covered by the employer while tail responsibility varies. Use $0 when the employer pays, and avoid deducting an expense already reflected in reported practice-owner net income. The lab now exposes both inputs with $0 defaults; the fixed gross-cash table remains unchanged.
Section 718 of Public Law 118-159 requires annual surveys on why military health care providers remain or separate, with reported data broken out by specialty, rank, years of service, and accession path. Those tabulations could help test whether pay, location, career opportunities, or workload are reported as salient factors. They are not a substitute for individual bonus eligibility, acceptance, and later separation records, and stated reasons alone do not identify a causal retention response. The supplied announcement workbook contains communications rather than those outcome observations, so it does not change the cash table or supply a retention elasticity.
The corrected FY25 Medical Corps pay guidance lists four-year annual RBs of $35,000 for pediatrics, $40,000 for general internal medicine, and $48,000 for family medicine. FY26 guidance lists $35,000, $48,000, and $48,000, respectively; the three fully qualified IP rates are $43,000 in both years. Thus, the FY26 internal-medicine four-year RB rose $8,000 annually, while the other two stayed flat. This is a pay-plan change, not an observed retention effect.
The 12-row table assumes a new FY26-rate agreement for every modeled physician. An actual physician may be serving an earlier agreement. FY26 guidance ties the IP associated with an RB agreement to the plan effective when the agreement began and sets conditions for termination and renegotiation. Eligibility also depends on completed prior obligations, licensure, privileges, specialty practice, and acceptance of a written agreement. Before using the model for an individual, enter the actual contract start, RB/IP rates, end date, and eligibility; the lab’s current-bonus input can represent a FY25-rate contract. For evaluation, record contract vintage and the FY26 policy change so its effect is not conflated with other changes.
White Coat Investor’s 2022 military pay review interprets GAO’s 2020 cross-specialty comparison, including the point that primary-care gaps vary by grade and specialty and that BAH was already counted before considering its tax advantage. The GAO report is the quantitative source; the article’s then-current dollars are not substituted into this San Diego model. WCI’s military-physician overview discusses pension, tax treatment, possible approved moonlighting, and the nonfinancial decision to serve. Its first-person account of military practice describes assignment uncertainty alongside leadership and mission opportunities. These accounts motivate the model’s separate benefit and assignment inputs but provide no causal estimate of how an additional bonus changes retention. The older HPSP financial illustration shows why training debt and discounting affect a lifetime comparison, not a current retention threshold for already-trained physicians.
Dahle’s 2012 stay-or-separate essay makes the comparison explicitly longitudinal: a physician who leaves gives up the chance to complete an active-duty retirement, while one who stays gives up earlier civilian earnings and some choice over location and deployments. It also points to tax-adjusted cash, the value of money available now, and reasons to stay such as leadership, distinctive clinical work, and service. Those are useful questions for this model and the proposed communication test, but the essay is a first-person financial illustration, not a Navy primary-care retention study. Its 2012 pay, tax percentages, annuity quotation, and legacy 50%-of-High-3 illustration are not inputs to the FY26 model. Current retirement system, actual service credit, household taxes, civilian offer, and likelihood of reaching retirement must be entered separately. A four-year scenario starting at 10 years and ending at 14 assigns no pension payment within the horizon; it does not establish that moving four years closer to the 20-year threshold has no value. A career-path sensitivity through potential retirement is needed to estimate that option value.
The 2019 White Coat Investor interview with Joel Schofer sharpens the communication hypothesis. Schofer said he gathered career information and job announcements dispersed across many places on MCCareer.org; therefore the comparison group may already have access to substantial information. The intervention should add accurate, specialty-specific detail about opportunities and eligibility, and the evaluation should measure baseline awareness and channel use. His discussion also pairs leadership and military training opportunities with uncertain assignments and clinical limitations. These are attributes to ask primary-care physicians about, not guaranteed benefits. His description of an emergency-medicine assignment algorithm and rough impressions of physician satisfaction cannot be generalized to today’s pediatrics, internal medicine, or family medicine or treated as retention statistics. The interview’s BRS and pension discussion is historical context; current DoD rules and actual retirement-system enrollment govern individual calculations.
These studies improve the decision design, but none supplies a causal estimate for a Navy primary-care information campaign or an FY26 San Diego retention threshold. The model’s salary and benefit defaults therefore remain grounded in current pay guidance and current comparator sources.
| Study | Evidence relevant to the decision | Use and boundary |
|---|---|---|
| Cronin, Morgan, and Weeks (2010) | Net-present-value comparisons of military and civilian career paths across five specialties, including internal medicine, using historical data. | Supports comparing complete paths and specialty sensitivity. Its 2003-era inputs and accession choices cannot price a current Navy retention agreement. |
| Todd et al. (2025) | Models lifetime, tax-adjusted outcomes of military and government medical-student scholarships; results depend on specialty and career path. | Supports taxes, education, pension, and horizon sensitivity. Scholarships already received are sunk at the later stay-or-leave choice; the study does not identify a retention bonus or the value of a message. |
| Burton, Fisher, and Barrett (2024) | In a 2021 voluntary survey, 61% of responding military family physicians felt fairly compensated versus 54% and 55% in separate civilian Medscape surveys; the difference was not statistically significant. Fifty-five percent said they would or had remained after obligation. | Shows perceived fairness and salary can diverge. The military survey had 186 completed responses from 2,562 emailed addresses, spans services, and measures stated or retrospective status rather than a prospective Navy retention effect. Do not turn 55% into a San Diego retention rate. |
| Song et al. (2020) | Among 310 respondents at a military medical meeting, having a mentor was associated with being likely to continue beyond obligation (adjusted odds ratio 3.9, 95% CI 1.2–12.1). | Record mentoring availability and participation. Conference sampling, stated intent, and observational association do not prove that offering a mentor or mentioning one causes retention. |
| Vie et al. (2024) | Links Army survey responses to observed voluntary separation. For Medical Corps respondents, family well-being, life predictability, and duty-station choice were associated with later separation (adjusted odds ratios 2.79, 2.43, and 2.99, respectively). | Strongest check against a message-only strategy: measure actual assignment and family conditions alongside awareness. These Army associations are not Navy causal effects and do not show pay is irrelevant. |
| Wojcik et al. (2020) | Of 4,334 Army physicians invited, 2,050 completed a 2018 survey. Satisfaction differed by rank, training, and facility type; respondents reported gaps in administrative support and recognition. | Stratify the Navy test by rank, career stage, and practice setting; verify support and clinical opportunity claims. Cross-sectional satisfaction is not observed retention. |
| House et al. (2023) | In one Army treatment facility, better relational coordination was associated with job satisfaction and intent to stay among nurses and physicians. | Measure team communication and actual mentoring or collaboration opportunities. Convenience sampling and intent outcomes prevent a causal Navy retention claim. |
| Menger et al. (2018) | A survey of military neurosurgeons reported both high enjoyment of service and substantial concern about military–civilian pay disparity and case volume. | Illustrates that nonpay value and pay concern can coexist; examine clinical volume. Neurosurgery is too different from primary care to calibrate this model. |
| Menger et al. (2016) | Compares economic and nonfinancial features of neurosurgery accession and early-service paths, including malpractice and overhead. | Checks which costs belong to each path. It does not establish primary-care salaries, Navy retention behavior, or the value of an existing pension. |
The policy implication is a sharper comparison: communicate verified, accessible opportunities, measure baseline knowledge, and separately test whether changing the underlying assignment or clinical conditions improves actual retention. A rise in satisfaction or intent is an intermediate result. Agreement acceptance and eventual separation are the behavioral outcomes. No odds ratio above should be entered into the lab as a probability of retention.
The following 17 items were reviewed for their contribution to the retention decision, not as inputs to the salary calculator. Studies 4, 5, and 15 repeat Vie, Wojcik, and House in the preceding table and are cross-referenced here rather than counted as new independent evidence. Intent, satisfaction, actual separation, and retention after a service obligation are distinct outcomes.
| Source | What it adds | Application and limit |
|---|---|---|
| 1. Boone et al. (2024) | Transnational co-creation and Delphi work identifies support, education, competitive pay, and workload/regulatory measures as a tailored package. | Use to specify feasible intervention arms and implementation checks; qualitative proposals are not effect estimates. |
| 2. Wynendaele et al. (2025) | Umbrella review of 37 reviews and 511 primary studies separates turnover intention from actual turnover and finds context-dependent, generally weak intervention evidence. | Require consistent outcome definitions and longer follow-up; the evidence is mostly nonmilitary and often nursing. |
| 3. Marble et al. (2020) | Army historical analysis says aggregate physician counts can conceal specialty and experience shortages, and calls for regular longitudinal opinion measurement. | Track Navy specialty, rank, billet, and experience alongside total headcount. It does not quantify a current Navy program effect. |
| 4. Vie et al. (2024) | Already analyzed above: Army sentiments linked to observed separation. | Keep family, predictability, and station choice in the evaluation; do not reuse its odds ratios as Navy probabilities. |
| 5. Wojcik et al. (2020) | Already analyzed above: Army physician satisfaction varies with rank, training, and facility. | Prespecify career-stage and facility strata; satisfaction is not separation. |
| 6. Pathman et al. (2004) | Descriptive state support-for-service study found longer practice tenure among obligated than nonobligated generalist physicians; loan repayment and direct incentives had relatively strong outcomes. | Keep financial support as a credible policy comparator. Rural placement and an earlier career-stage commitment differ from a Navy physician’s next agreement; selection and obligation effects prevent a bonus-size inference. |
| 7. Verma et al. (2016) | Systematic review found weak intervention evidence for recruiting and retaining primary-care doctors; training placements and selective recruitment had some support. | Distinguish recruiting a future physician from retaining an experienced one. Do not present an information campaign as established practice. |
| 8. Arredondo et al. (2026) | U.S. rural primary-care scoping review found financial and educational programs promising among those reporting outcomes, but many programs lacked standardized post-obligation retention data. | Compare any future pay or development proposal by post-agreement retention, specialty, and location. Rural program rates cannot be transplanted to San Diego Navy practice. |
| 9. Walensky and McCann (2025) | Reviews national physician-workforce challenges and argues for broader education and compensation reform. | Supplies labor-market context, not a local Navy retention estimate or causal intervention test. |
| 10. Greener et al. (2023) | Army physician-assistant cross-sectional survey discusses growth counseling and perceived ability to reach career goals. | Test a documented career-planning offer if relevant; physician assistants and stated intentions cannot establish physician retention. |
| 11. Um et al. (2026) | USU alumni survey found postgraduate professional education associated with higher self-reported likelihood of staying (adjusted mean 3.46 versus 2.88 with no such education). | Verify protected time, eligibility, completion, and career utility of real education options. Cross-sectional selection and stated likelihood do not establish that education causes continued service. |
| 12. Guille and Sen (2024) | Reviews physician burnout, depression, and diminished well-being. | Include workload and well-being measures as potential competing mechanisms, without equating a screening score to observed retention. |
| 13. Silver et al. (2016) | Reviews physician retirement planning and timing. | Separate midcareer agreement decisions from approaching-retirement decisions; the pension’s value and plans to continue clinical work vary by career stage. No Navy pension parameter comes from this review. |
| 14. Wakerman et al. (2019) | Remote Australian workforce synthesis favors coordinated, flexible, locally matched retention packages and highlights an implementation gap. | Useful for thinking about Guam and other remote assignments, but its largely nonphysician remote-workforce rates cannot be used for San Diego Navy primary care. |
| 15. House et al. (2023) | Already analyzed above: relational coordination in one Army facility correlates with satisfaction and intent to stay. | Measure team function and actual retention separately. |
| 16. Carlasare et al. (2026) | Cross-sectional survey of 14,051 U.S. physicians links belonging to lower burnout and lower intent to leave an organization. | Measure belonging and teammate support as possible mechanisms; do not turn association with intent into a Navy separation effect. |
| 17. Okpalauwaekwe et al. (2025) | Canadian family-medicine integrative review maps interacting personal, family, professional, community, and system conditions. | Ask which constraints apply to each Navy physician; Canadian practice and rural contexts differ from San Diego military service. |
The evidence does not rank a communication campaign above pay or operational changes. The revised decision test therefore specifies: (a) verified information about opportunities that already exist, (b) where feasible, a concrete improvement in access to an assignment, clinical, mentoring, or education opportunity, and (c) continued measurement of current compensation and any separately authorized pay changes. For each, record eligibility, exposure, actual uptake, cost, and observed agreement acceptance and post-obligation retention. Compare like physicians within specialty, rank, facility, and civilian-pay-gap strata. Report any staffing benefit by billet and Pacific-relevant clinical capacity rather than inferring it from intent or satisfaction.
An independent MCCareer.org post reports a revised promotion flow point for newer Medical Corps cohorts. This reinforces the need for an individual date of rank and a stated promotion scenario: the table’s fixed O-4 path is a controlled comparison, not an expected career path. The post is not an official promotion order or a probability estimate.
The official FY26 Medical Corps pay table also offers six-year annual RB rates of $40,000 for pediatrics and $60,000 for general internal and family medicine, compared with four-year rates of $35,000/$48,000/$48,000. Agreement length is therefore an additional policy variable. A valid six-year comparison needs a six-year cash path, the added two years of obligation, and retention measured after the longer agreement; the present four-year figure cannot evaluate it.
For pension sensitivity, a DoD retirement-credit memorandum hosted by MCCareer distinguishes USU medical-student service used to compute retired pay from service used to qualify for 20-year retirement. MCCareer’s 2026 article highlights verification of USU and qualifying HPSP active-training credit on the retirement Statement of Service. Record accession path and actual creditable student/training periods; do not add all school years to the 20-year eligibility clock or assume the same pension multiplier for every physician. This does not change the gross-cash results.